Searching for a reliable monthly income stream from your investment portfolio? The JPMorgan Nasdaq Equity Premium Income ETF (JEPQ) has emerged as one of the most popular dividend-generating ETFs in 2026, attracting billions in investor capital with its attractive monthly distributions and tech-focused strategy. With a current dividend yield of 10.9% and over $34 billion in assets under management, JEPQ dividend payments have become a cornerstone for income-focused investors seeking exposure to high-growth technology stocks while generating consistent cash flow.
This comprehensive guide explores everything you need to know about JEPQ dividends in 2026—from payment schedules and yield analysis to tax considerations and investment suitability. Whether you’re planning for retirement income or building a dividend portfolio, understanding how JEPQ generates its impressive yields is essential for making informed investment decisions.
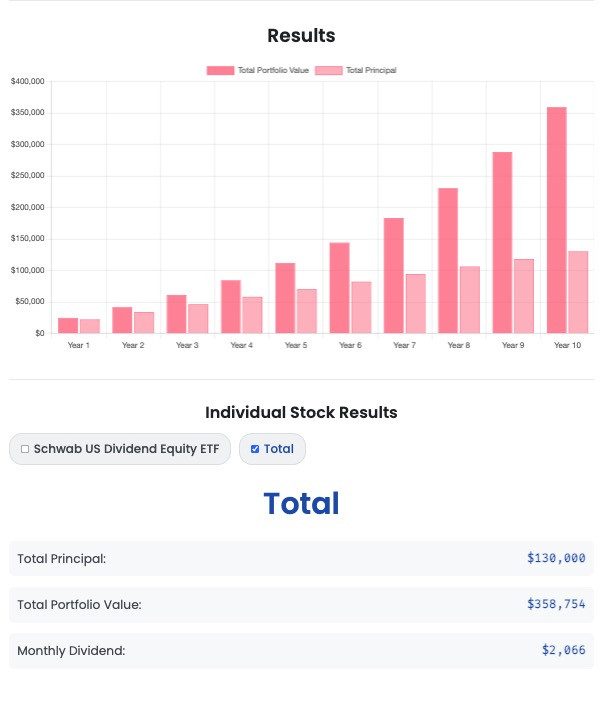
💰 Calculate Your JEPQ Dividend Income Potential
Before diving into the details, see exactly how much monthly income you could generate with JEPQ using the Dividend Whale Calculator. Simply input your investment amount to visualize your potential cash flow from JEPQ’s monthly distributions.
👇 Check it out now!
🐳 Dividend calculator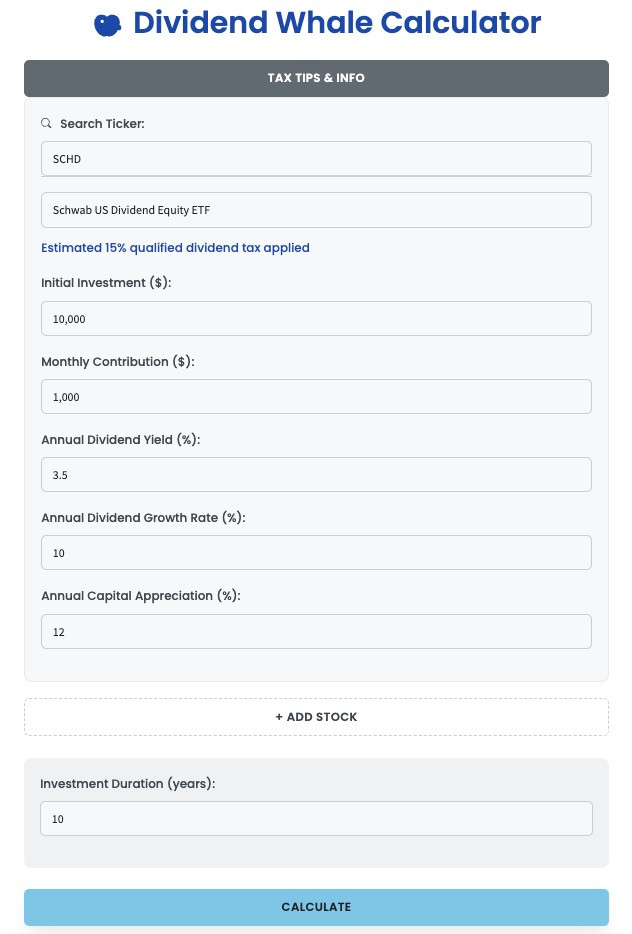
📊 What is JEPQ and How Does It Generate Dividends?
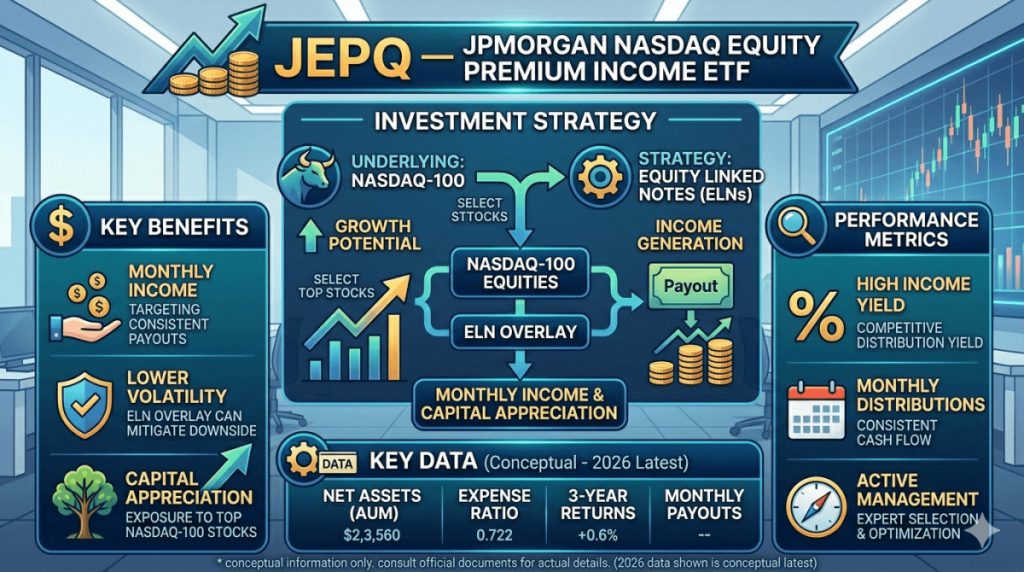
JEPQ (JPMorgan Nasdaq Equity Premium Income ETF) is an actively managed exchange-traded fund that combines equity ownership with options income strategies to deliver high monthly dividend yields to investors. Launched by JPMorgan Asset Management, JEPQ has quickly become one of the most sought-after income ETFs in the market.
The Dual-Strategy Approach
JEPQ employs a sophisticated two-part strategy to generate its attractive dividend income. First, the fund maintains an actively managed portfolio of stocks primarily from the Nasdaq-100 Index, which includes the largest non-financial companies trading on the Nasdaq exchange. These holdings provide exposure to high-quality technology and growth companies like Apple, Microsoft, Amazon, and Alphabet.
Second, JEPQ implements a covered call strategy using equity-linked notes (ELNs) that sell out-of-the-money call options on the Nasdaq-100 Index. This options overlay generates substantial premium income, which is distributed to shareholders as monthly dividends. The higher volatility of tech and growth stocks translates to larger premiums, enabling JEPQ to offer yields significantly higher than traditional dividend stocks.
Portfolio Holdings Composition
Understanding what you own when you invest in JEPQ is crucial for evaluating the fund’s risk profile and potential performance. JEPQ’s top holdings include NVIDIA at 7.2%, Apple at 6.4%, Alphabet at 5.3%, Microsoft at 4.9%, Amazon at 3.9%, and Meta Platforms at 3.3%. These mega-cap technology leaders dominate the portfolio, with Information Technology representing 41.1% of the fund’s sector allocation.
This heavy technology concentration is both a strength and a consideration. On one hand, you’re investing in some of the world’s most innovative, profitable, and dominant companies. On the other hand, sector concentration means your JEPQ dividends and portfolio value are closely tied to the fortunes of the technology sector. When tech thrives, JEPQ tends to perform well; when tech struggles, JEPQ feels the pain proportionally.
How the Income is Generated
The dividend income you receive from JEPQ comes primarily from two sources: the option premiums collected from selling covered calls and, to a lesser extent, dividends from the underlying stock holdings. When JEPQ sells call options, it receives immediate premium income in exchange for agreeing to sell shares at a specified price (the strike price) if the market rises above that level. This strategy works particularly well in sideways or moderately rising markets, where the fund collects premiums month after month while maintaining most of its equity exposure.
The active management component allows the portfolio managers to make tactical decisions about which stocks to hold and how aggressively to write options, potentially optimizing the balance between income generation and capital appreciation. Unlike passive index strategies, JEPQ’s managers can adjust holdings based on their analysis of individual company fundamentals and market conditions.
The Equity-Linked Notes (ELN) Structure
JEPQ doesn’t sell options directly on each individual stock it owns. Instead, it uses equity-linked notes from major financial institutions to implement its covered call strategy on the Nasdaq-100 Index as a whole. ELNs are structured products that provide economic exposure similar to owning stocks and selling calls, but with some operational advantages for a fund of JEPQ’s size.
The ELN approach allows JEPQ to efficiently implement its strategy at scale without the complexities of managing thousands of individual option positions. It also provides flexibility in adjusting the level of call writing month to month based on market conditions and volatility levels. When volatility is high and option premiums are attractive, the managers can be more aggressive in their covered call writing; when volatility is low, they may dial back to preserve more upside potential.
📈 JEPQ Dividend Characteristics and Performance
Understanding the unique characteristics of JEPQ’s dividend structure is crucial for evaluating whether this ETF fits your investment strategy and income needs.
Monthly Distribution Schedule
Unlike traditional quarterly dividend payers, JEPQ distributes income on a monthly basis, providing investors with a steady cash flow stream throughout the year. The latest dividend distribution was $0.559 for April 2026 with an ex-dividend date of April 1, 2026 and a pay date of April 6, 2026. This monthly payment structure makes JEPQ particularly attractive for retirees and income-focused investors who prefer regular distributions to cover living expenses.
Monthly dividends offer significant practical advantages over quarterly payouts. Instead of receiving large chunks of income four times per year, you get more frequent, smaller distributions that can smooth out your cash flow planning. This can be especially valuable for retirees who need predictable monthly income to cover expenses like housing, utilities, and healthcare.
Variable Monthly Payments
It’s important to note that JEPQ’s monthly dividend amounts vary based on the option premium income generated each month. Unlike fixed-income investments or some traditional dividend stocks with stable payouts, JEPQ’s distributions fluctuate depending on market volatility and the premiums received from selling call options. Higher market volatility typically results in higher option premiums and thus larger dividend payments.
For example, during periods of market turbulence or heightened uncertainty, option prices tend to rise as investors seek protection or speculate on larger price swings. In these environments, JEPQ can collect more substantial premiums when writing calls, leading to bigger monthly distributions. Conversely, during calm, low-volatility periods, option premiums compress, and JEPQ’s distributions may decline somewhat.
This variability means you shouldn’t budget based on the assumption that you’ll receive exactly the same amount every month. Instead, think in terms of a range or average distribution level, understanding that some months will pay more and others less depending on market conditions.
Historical Dividend Growth
JEPQ paid out $6.18 in dividends per share over the past 12 months, representing an increase of 7.21% from the previous year. This growth trajectory reflects both the fund’s growing asset base and favorable market conditions for options income generation. JEPQ has increased its dividend 4 years in a row, demonstrating consistency in its income-generation model despite the inherent variability in monthly payments.
The four-year streak of annual dividend growth is particularly noteworthy because it shows that even though individual months fluctuate, the overall trend has been upward. This growth comes from a combination of factors: increasing assets under management that provide economies of scale, effective active management that captures attractive option premiums, and generally favorable volatility conditions in the technology sector.
However, past growth doesn’t guarantee future increases. Dividend growth in covered call ETFs depends heavily on market volatility levels, which are inherently unpredictable. Investors should view the historical growth as encouraging but not as a reliable forecast of future performance.
Yield Comparison to Market Benchmarks
With a current dividend yield of 10.9%, JEPQ significantly outpaces traditional market benchmarks. For context, the average S&P 500 stock yields around 1.3%, while traditional bond yields remain in the 4-5% range for investment-grade corporate bonds. Even high-yield bonds typically offer yields in the 6-8% range, making JEPQ’s double-digit yield exceptionally attractive on a surface level.
This substantial yield differential makes JEPQ an attractive option for investors prioritizing income generation. A $100,000 investment in JEPQ generating a 10.9% yield produces approximately $908 per month in gross income, compared to just $108 per month from a 1.3% yielding S&P 500 index fund. For income-dependent retirees, this difference can be life-changing.
However—and this is critical—the higher yield comes with specific trade-offs that we’ll explore in depth later. JEPQ achieves its high yield by giving up upside potential through covered call writing, so the yield isn’t “free money” but rather a trade-off between current income and long-term capital appreciation.
Distribution Stability and Predictability
While JEPQ’s distributions vary month to month, they’ve shown reasonable stability within a range. Looking at the past year’s distributions, monthly payments have typically ranged from about $0.48 to $0.65 per share, with most months clustered in the $0.52-$0.60 range. This degree of variability is manageable for most income investors, especially those who maintain a cash buffer to smooth out the monthly fluctuations.
For retirees relying on JEPQ distributions for living expenses, a prudent approach is to budget based on a conservative estimate—perhaps the lower end of the historical range—and treat months with higher distributions as a bonus that can be reinvested or saved for future needs.
Tax Considerations in Detail
JEPQ dividends are generally classified as ordinary income rather than qualified dividends, which means they’re taxed at your regular income tax rate rather than the more favorable 15-20% qualified dividend rate. This tax treatment is typical for covered call ETFs because the income derives primarily from option premiums rather than traditional stock dividends.
For an investor in the 24% federal tax bracket, a 10.9% yield becomes a 8.28% after-tax yield once federal taxes are accounted for—still attractive, but notably less impressive than the headline number. Add in state income taxes (which can range from 0% to over 13% depending on your state), and the after-tax yield may drop to 7-8% for higher-income investors in high-tax states.
This tax inefficiency makes JEPQ significantly more attractive in tax-advantaged accounts. In a traditional IRA, you defer all taxes until withdrawal in retirement, potentially at a lower tax bracket. In a Roth IRA, assuming you meet the qualified distribution requirements, you pay no taxes on the distributions at all, allowing you to capture the full 10.9% yield tax-free.
🔍 JEPQ vs. Competing Covered Call ETFs
To fully appreciate JEPQ’s position in the covered call ETF landscape, let’s examine how it compares to its primary competitors across key metrics that matter to dividend investors.
| Feature | JEPQ | JEPI | QQQI | DIVO |
|---|---|---|---|---|
| Dividend Yield | 10.9% | 8.6% | 14.2% | 4.9% |
| Underlying Index | Nasdaq-100 | S&P 500 | Nasdaq-100 | Dividend Growth Stocks |
| Distribution Frequency | Monthly | Monthly | Monthly | Quarterly |
| Expense Ratio | 0.35% | 0.35% | 0.94% | 0.55% |
| Assets Under Management | $34.5B | $35B | $1.8B | $2.1B |
| Strategy | Active + Covered Calls | Active + Covered Calls | Index Options Spreads | Partial Covered Calls (20-30%) |
| Tech Exposure | High | Medium | High | Low-Medium |
| Tax Efficiency | Standard | Standard | Section 1256 Advantage | Standard |
| Volatility (Std Dev) | Medium-High | Medium | Medium-High | Medium-Low |
| Total Return (3-Year) | 19.14% annualized | ~15% annualized | Limited history | ~12% annualized |
JEPQ vs. JEPI: The JPMorgan Siblings
Both managed by JPMorgan Asset Management with identical 0.35% expense ratios, the key difference lies in their underlying exposures. JEPI targets the S&P 500 with an 8.57% yield while JEPQ targets the Nasdaq-100 with a 10.58% yield. The higher yield on JEPQ reflects the greater volatility of technology stocks, which generates richer option premiums.
JEPI’s S&P 500 focus provides broader market diversification across all sectors of the economy—not just technology. This makes JEPI less susceptible to tech-specific downturns but also limits its upside during technology rallies. JEPI might be the better choice for investors who want income with more diversified equity exposure, while JEPQ suits those who specifically want tech-heavy income generation.
The yield difference of approximately 2-2.5 percentage points translates to meaningful income differences over time. On a $100,000 investment, JEPQ would generate roughly $200-250 more per month than JEPI, which adds up to $2,400-$3,000 per year. For income-focused investors, this difference can be significant.
JEPQ vs. QQQI: Maximum Yield vs. Complexity
QQQI offers an even higher yield than JEPQ but employs a more complex strategy using Section 1256 index options. QQQI delivers a 14.22% yield with favorable tax treatment in taxable accounts. However, QQQI’s distributions are classified almost entirely as return of capital, which defers taxation but can complicate basis tracking and financial planning.
Return of capital distributions aren’t taxed immediately; instead, they reduce your cost basis in the fund. You only pay taxes when you sell shares, at which point the accumulated return of capital increases your capital gain. For sophisticated investors comfortable with this structure and tracking their adjusted basis, QQQI can offer superior after-tax income in taxable accounts.
However, QQQI’s higher expense ratio (0.94% vs. JEPQ’s 0.35%) eats into returns, and its smaller asset base means it hasn’t achieved the same economies of scale as JEPQ. Additionally, QQQI’s options spread strategy is more mechanistic and less actively managed than JEPQ’s approach, which could be an advantage or disadvantage depending on market conditions.
JEPQ vs. DIVO: Income vs. Growth Preservation
DIVO takes a fundamentally different approach by writing covered calls on only 20-30% of its portfolio, allowing more upside participation during bull markets. While DIVO’s 4.9% yield is much lower than JEPQ’s, it tends to preserve capital better during strong market rallies, making it more suitable for investors who want some income enhancement without fully capping their growth potential.
DIVO’s partial covered call approach represents a middle ground between pure equity ownership and full covered call writing. You get some of the benefits of each strategy: higher income than a plain vanilla dividend stock fund, but more growth potential than a fund like JEPQ that writes calls on most or all of its holdings.
For investors in accumulation phase who still have decades until retirement, DIVO might make more sense as it balances income with growth. For investors already in retirement who prioritize current cash flow over long-term appreciation, JEPQ’s more aggressive covered call strategy and higher yield could be more appropriate.
Strategic Allocation Approach
Rather than viewing these ETFs as mutually exclusive choices, sophisticated investors might consider holding a combination of them to balance different objectives. For example, a retiree might allocate:
- 40% to JEPQ for maximum monthly income
- 30% to JEPI for broad-market income exposure
- 30% to DIVO or traditional dividend growth stocks for some upside participation
This diversified approach captures high current income while maintaining some growth potential and sector diversification, reducing reliance on any single fund or strategy.
📅 2026 JEPQ Dividend Payment Calendar & Key Dates
Understanding JEPQ’s dividend timeline helps you plan your cash flow and make informed purchase decisions to maximize your distributions.
Monthly Distribution Pattern
JEPQ follows a consistent monthly distribution schedule with payments occurring early in each month. The typical timeline works as follows:
- Ex-Dividend Date: The 1st business day of each month (or next business day if the 1st falls on a weekend)
- Record Date: The 2nd business day of each month
- Payment Date: Approximately 3-5 business days after the ex-dividend date, typically landing between the 5th and 8th of the month
Upcoming 2026 Dividend Schedule
| Month | Ex-Dividend Date | Record Date | Payment Date | Recent Distribution* |
|---|---|---|---|---|
| April 2026 | April 1 | April 2 | April 6 | $0.559 |
| May 2026 | May 1 | May 2 | May 7 | Est. $0.55-$0.60 |
| June 2026 | June 2 | June 3 | June 7 | Est. $0.55-$0.60 |
| July 2026 | July 1 | July 2 | July 7 | Est. $0.55-$0.60 |
| August 2026 | August 3 | August 4 | August 8 | Est. $0.55-$0.60 |
| September 2026 | September 1 | September 2 | September 6 | Est. $0.55-$0.60 |
| October 2026 | October 1 | October 2 | October 6 | Est. $0.55-$0.60 |
| November 2026 | November 2 | November 3 | November 7 | Est. $0.55-$0.60 |
| December 2026 | December 1 | December 2 | December 6 | Est. $0.55-$0.60 |
*Note: Future distribution amounts are estimates based on recent payment history and may vary based on market conditions and option premium income. The fund does not commit to any specific distribution amount.
Strategic Timing for New Investors
To receive a dividend payment, you must purchase JEPQ shares before the ex-dividend date and hold them through the record date. If you buy shares on or after the ex-dividend date, you won’t receive that month’s distribution—instead, you’ll need to wait until the following month.
This creates a strategic consideration for new investors: should you buy just before the ex-dividend date to capture the upcoming distribution, or wait until after to potentially get a better price?
The answer depends on market conditions and your time horizon. In theory, the share price should drop by approximately the distribution amount on the ex-dividend date, meaning you don’t get “free money” by buying right before the dividend. However, in practice, other market forces often overwhelm this theoretical adjustment, so you may or may not see a price drop matching the distribution.
For long-term investors planning to hold JEPQ for years, the timing of your initial purchase relative to the ex-dividend date matters very little. Over dozens or hundreds of monthly distributions, whether you captured the first one or waited until the second is essentially irrelevant to your total returns.
For investors deploying larger amounts of capital, consider dollar-cost averaging your purchases across multiple months to avoid buying in at a temporarily elevated price. This approach can help smooth out your average purchase price and reduce timing risk, while ensuring you’re consistently buying shares that will qualify for upcoming distributions.
Distribution Reinvestment Strategies
Many brokers offer automatic dividend reinvestment programs (DRIPs) that allow you to automatically use your JEPQ distributions to purchase additional shares. This can be a powerful compounding strategy if you don’t need the current income.
Let’s look at the math: if you invest $100,000 in JEPQ at a 10% yield and reinvest all distributions, assuming the fund maintains its share price and yield:
- Year 1: Your investment grows to $110,000
- Year 5: Your investment grows to approximately $161,051
- Year 10: Your investment grows to approximately $259,374
That’s the power of compounding monthly dividends over time. Of course, this assumes constant share price and yield, which won’t happen in reality—share prices fluctuate, and yields vary with market conditions. But it illustrates how reinvesting distributions can significantly accelerate wealth building.
Alternatively, some investors take a hybrid approach: reinvest distributions during their accumulation years to build the portfolio, then switch to taking distributions as cash income once they retire and need the money for living expenses.
Annual Distribution Projections
Based on the most recent 12-month distribution of $6.18 per share and current market conditions, investors can reasonably expect annual distributions in the $6.00-$6.50 range for 2026, though this can vary significantly based on market volatility levels.
Higher volatility periods typically result in higher option premiums and thus larger distributions, while calm markets may produce more modest income. If you’re budgeting for retirement income, it’s prudent to use a conservative estimate—perhaps $6.00 per share annually—rather than assuming the maximum possible distribution.
At the current share price of approximately $58, this translates to a yield of roughly 10.3-11.2%, providing a reasonable range for planning purposes. However, always remember that both the distribution amount and the share price can fluctuate, affecting both your income stream and your principal value.
⚠️ 3 Critical Risks Every JEPQ Investor Must Understand
While JEPQ’s high yield is attractive, informed investors must understand the inherent risks and trade-offs that come with this covered call strategy.
1. Capped Upside in Strong Bull Markets
The fundamental trade-off of JEPQ’s covered call strategy is that it limits your ability to participate fully in strong market rallies. When you sell call options, you essentially agree to sell your upside above a certain price in exchange for immediate premium income. Out-of-the-money covered calls have a strike price above the current index price, but they still cap upside potential, especially in cases where indexes are rising quickly and outpacing the gains from call premiums.
Let’s make this concrete with a hypothetical scenario: Suppose the Nasdaq-100 rallies 30% in a year (not unprecedented for technology-heavy indexes during bull markets). A traditional Nasdaq-100 index fund investor would capture that full 30% gain (plus a small dividend yield). A JEPQ investor, however, might capture only 15-18% total return—the fund participates in the initial rally up to the strike prices of its sold calls, collects option premium income, but misses out on the strongest part of the upside when the market blows through those strike prices.
In 2025, when the Nasdaq-100 experienced rapid appreciation, JEPQ lagged the Invesco QQQ ETF on a total return basis because the covered calls limited how much of that rally JEPQ shareholders could capture. This is not a flaw in JEPQ’s strategy—it’s the intentional design. Investors choosing JEPQ are explicitly trading potential capital appreciation for current income.
This makes JEPQ unsuitable for investors whose primary goal is long-term wealth building through capital appreciation. If you’re a 30-year-old accumulating wealth for retirement 35 years in the future, you probably want to capture the full upside of equity markets rather than trading that upside for current income you don’t need yet.
However, for a 65-year-old retiree who needs income today and has limited ability to recover from sequence-of-returns risk in retirement, giving up some upside potential in exchange for reliable monthly cash flow can be a very sensible trade-off.
2. Limited Downside Protection in Sharp Sell-Offs
A common misconception about covered call strategies is that they provide significant downside protection. While the premium income does offer a cushion, this protection is more limited than many investors realize—especially during sudden, sharp market declines.
JEPI and JEPQ will get hit hard by a short and sudden sell-off, as seen in April 2025 and March 2026, when tariff-induced sell-offs caused both funds to decline almost as much as their underlying indexes. The option premium income does provide a cushion, but it’s typically equivalent to only 0.8-1.2% of the portfolio value per month. In a market that drops 10-15% in a matter of weeks, that premium offers only modest protection.
To illustrate: If JEPQ collects 1% in monthly option premiums and the Nasdaq-100 drops 12% in a month, JEPQ might drop 11%—still a painful decline, just slightly less painful than the full 12%. Over longer periods, the accumulated premiums can provide meaningful protection, but in sharp, sudden selloffs, the cushion is limited.
The covered call strategy works best in sideways or gradually declining markets, where the monthly premiums can accumulate over many months to offset slow portfolio erosion. In a sideways market where the Nasdaq-100 goes nowhere for two years, JEPQ investors would still collect roughly 20-24% in cumulative distributions, coming out far ahead of investors who simply held the index.
But JEPQ doesn’t shield investors from severe bear markets. If technology stocks enter a prolonged downturn like the 2000-2002 tech bust (when the Nasdaq fell over 70%), JEPQ would suffer significant losses—perhaps less severe than the index thanks to the option premium cushion, but still substantial.
3. Tax Inefficiency in Taxable Accounts
JEPQ’s distributions are primarily classified as ordinary income, taxed at your marginal income tax rate rather than the preferential 15-20% qualified dividend rate. For investors in the 32% or 37% federal tax brackets, this means giving up nearly a third or more of your distribution to taxes, significantly reducing your after-tax yield.
Let’s run the numbers for different tax situations:
Scenario 1: Low Tax Bracket Investor (12% federal)
- Gross yield: 10.9%
- Federal tax: 1.31%
- After-tax yield: 9.59%
Scenario 2: Mid Tax Bracket Investor (24% federal, 5% state)
- Gross yield: 10.9%
- Federal tax: 2.62%
- State tax: 0.55%
- After-tax yield: 7.73%
Scenario 3: High Tax Bracket Investor (37% federal, 13.3% California)
- Gross yield: 10.9%
- Federal tax: 4.03%
- State tax: 1.45%
- After-tax yield: 5.42%
That’s a dramatic difference! The high-bracket California investor is giving up almost half of the gross yield to taxes, bringing the after-tax return down to a level that might not beat high-quality municipal bonds on an after-tax basis.
Additionally, JEPQ’s active management and frequent options trading result in high portfolio turnover, which can generate short-term capital gains that are also taxed at ordinary income rates. The fund’s turnover ratio can exceed 150% annually, meaning the entire portfolio turns over more than once per year on average.
For these reasons, JEPQ is generally more suitable for tax-advantaged accounts like traditional IRAs, Roth IRAs, or 401(k)s, where the tax impact is deferred or eliminated entirely. Investors holding JEPQ in taxable accounts should carefully calculate their after-tax yield and compare it to alternative investments that might offer better tax efficiency.
Tax-equivalent yield comparisons are essential: a municipal bond yielding 5% tax-free might actually provide more after-tax income than JEPQ’s 10.9% yield for investors in high tax brackets, while also offering greater principal stability and no equity market risk.
💡 Ideal Investor Profiles for JEPQ Dividends
JEPQ isn’t a one-size-fits-all investment. Here are the investor types who benefit most from JEPQ’s dividend strategy, along with those who should probably look elsewhere.
Perfect Fit #1: Retirement Income Seekers in Tax-Advantaged Accounts
Retirees who need consistent monthly cash flow to cover living expenses and can hold JEPQ in IRAs or Roth IRAs are ideal candidates. The monthly distribution schedule aligns perfectly with regular expense patterns, and the high yield can provide substantial income from a relatively modest investment. A $100,000 investment in JEPQ generating a 10% yield produces approximately $833 per month in gross income—meaningful money for covering retirement expenses.
The tax-advantaged wrapper eliminates the ordinary income tax disadvantage, allowing you to capture the full yield. In a Roth IRA (assuming you meet qualified distribution requirements), that $833 monthly is completely tax-free—a powerful combination for retirees.
Perfect Fit #2: Income-Focused Investors with Long-Term Tech Conviction
If you believe in the long-term prospects of large-cap technology companies but want to generate income along the way rather than just hoping for price appreciation, JEPQ offers an attractive middle ground. You get exposure to the Nasdaq-100’s tech leaders—companies like NVIDIA, Apple, Alphabet, Microsoft, Amazon, and Meta —while earning significantly more income than you would from a traditional index fund.
This profile suits investors who want technology exposure but have already accumulated substantial wealth and are now prioritizing income over aggressive growth. Perhaps you’re in your 50s, have built a seven-figure portfolio through decades of growth investing, and are now transitioning toward income generation as retirement approaches.
Perfect Fit #3: Conservative Equity Investors Seeking Volatility Reduction
While JEPQ still experiences equity market volatility, its covered call strategy does modestly reduce price swings compared to owning the Nasdaq-100 outright. JEPQ’s standard deviation since inception is 13.56 compared to 18.77 for the Nasdaq-100 Index, representing about 28% lower volatility.
For investors who want some equity market exposure for inflation protection but find the Nasdaq-100’s wild swings psychologically difficult to handle, JEPQ’s smoother ride combined with meaningful monthly income can make it easier to stay invested through market turbulence.
Acceptable Fit: Diversified Retirees Using JEPQ as One Income Source
JEPQ can work as one component of a diversified retirement income portfolio that also includes bonds, traditional dividend stocks, real estate, and perhaps an annuity for guaranteed lifetime income. By allocating perhaps 15-25% of your portfolio to JEPQ, you can boost your overall portfolio yield while limiting your exposure to the specific risks of covered call strategies.
This approach gives you the benefit of JEPQ’s high income without putting all your eggs in one basket. If JEPQ disappoints during a particular market environment, your other holdings can pick up the slack.
Poor Fit: Young Accumulators Seeking Maximum Long-Term Growth
If you’re in your 20s, 30s, or even 40s and still accumulating wealth for retirement decades in the future, JEPQ is probably not your best choice. The capped upside means you’ll miss out on significant long-term compounding that could make a huge difference over 20-40 year time horizons.
A simple Nasdaq-100 index fund or diversified equity portfolio will likely serve you better, allowing you to capture the full upside of equity markets and reinvest any dividends for maximum compounding. You don’t need high current income yet—you need maximum wealth accumulation.
Poor Fit: High Tax Bracket Investors in Taxable Accounts
If you’re in the 32% or 37% federal tax bracket and can only hold JEPQ in a taxable brokerage account (perhaps you’ve maxed out all your retirement accounts), the after-tax yield becomes much less attractive. High-quality municipal bonds, qualified dividend stocks, or even traditional growth stocks with low dividend yields might serve you better from a total after-tax return perspective.
Poor Fit: Risk-Averse Investors Seeking Capital Preservation
Despite the income focus, JEPQ is still an equity investment subject to substantial market risk. The covered call strategy provides only modest downside protection. If your primary goal is preserving your principal and you cannot emotionally tolerate seeing your investment potentially drop 20-30% during a bear market, JEPQ is not appropriate. Consider high-quality bonds, CDs, or even high-yield savings accounts instead.
❓ Frequently Asked Questions About JEPQ Dividends
1. How often does JEPQ pay dividends, and can I rely on them for monthly income?
JEPQ pays dividends monthly, typically with an ex-dividend date on the first business day of each month and payment occurring 3-5 business days later. This makes it well-suited for investors seeking regular monthly income. However, the monthly payment amounts vary based on option premium income generated, so you’ll receive 12 distributions per year but not necessarily the exact same amount each month. Most investors can reliably count on distributions within a fairly consistent range, making JEPQ practical for retirement income planning as long as you budget conservatively.
2. Are JEPQ dividends qualified or ordinary income, and why does it matter?
JEPQ dividends are primarily classified as ordinary income, not qualified dividends, because they derive mainly from option premium income rather than traditional stock dividends. This matters significantly because ordinary income is taxed at your regular income tax rate (potentially as high as 37% federally), while qualified dividends receive preferential tax treatment (maximum 20% federally). For an investor in the 32% bracket, this difference can reduce JEPQ’s after-tax yield by over 1.5 percentage points compared to if the distributions were qualified. This tax treatment makes JEPQ much more attractive in tax-advantaged retirement accounts (IRAs, 401ks) where distributions aren’t taxed until withdrawal or not at all in the case of Roth accounts.
3. Can JEPQ’s dividend be cut, and what would cause that to happen?
Yes, JEPQ’s dividend can fluctuate month-to-month and could potentially decrease if market conditions change. The distributions come primarily from option premiums collected by selling covered calls, and those premiums rise and fall with market volatility. In periods of low volatility, option premiums shrink, potentially leading to smaller distributions. Additionally, if the Nasdaq-100 experiences a severe prolonged decline, the fund’s net asset value would drop, which could eventually force distribution reductions. However, the fund has no formal commitment to maintain any specific distribution level, so management could adjust payments based on market conditions without “cutting” a promised dividend.
4. What’s the difference between JEPQ and JEPI dividends, and which should I choose?
The primary difference is the underlying exposure and resulting yield. JEPI targets the S&P 500 with a yield around 8.57%, while JEPQ targets the Nasdaq-100 with a higher yield around 10.58% JEPQ’s higher yield reflects the greater volatility of technology stocks, which produces richer option premiums. JEPQ is better for investors who want maximum income and are comfortable with heavy technology sector concentration, while JEPI suits those who prefer broader market diversification with somewhat lower but still attractive income. Some investors hold both to get blended exposure. Both have identical 0.35% expense ratios and are managed by the same team at JPMorgan.
5. Is JEPQ’s dividend sustainable long-term, or is this too good to last?
JEPQ’s dividend sustainability depends on continued market volatility and the viability of its covered call strategy rather than on unsustainable payouts from principal. The fund generates real income from option premiums rather than just distributing its own capital back to investors. JEPQ has increased its dividend 4 years in a row, suggesting the strategy has worked through various market conditions. However, future distributions will vary with volatility levels—calm markets produce lower option premiums and thus smaller distributions, while volatile markets enhance premium income. The covered call strategy itself is well-established and has been used successfully for decades, so JEPQ’s approach is proven. That said, don’t assume the current 10%+ yield is guaranteed indefinitely. A more conservative assumption might be that JEPQ will deliver yields in the 8-12% range depending on market conditions over the coming years.
6. How does JEPQ perform during market downturns compared to regular tech stocks?
JEPQ typically declines less than the Nasdaq-100 during gradual market downturns because the option premium income provides a cushion, but performs similarly during sharp, sudden selloffs. During the 2026 market pullback, when the NDX experienced a maximum drawdown of 13.1%, JEPQ corrected approximately 7.1% notably less severe but still meaningful. The protection works best in slow-moving bear markets where monthly premiums accumulate to offset portfolio erosion. In fast-crash scenarios, the single month of premium collected before the crash offers only limited protection (typically 1-1.5% cushion). Think of JEPQ as providing a modest helmet rather than full armor during market crashes.
7. Should I reinvest JEPQ dividends or take them as cash?
This depends entirely on your financial situation and goals. If you need the income for current living expenses (common in retirement), take the distributions as cash—that’s what they’re designed for. If you’re still accumulating wealth and don’t need current income, reinvesting through a DRIP (dividend reinvestment program) allows you to compound your returns by automatically purchasing more shares with each distribution. Reinvesting a 10% yield can significantly accelerate portfolio growth over time. Some investors use a hybrid approach: reinvest during accumulation years, then switch to cash distributions once retired. There’s no universally correct answer—align the strategy with your personal cash flow needs.
8. What investment size makes sense for generating meaningful income from JEPQ?
This depends on how much monthly income you need. At a 10% yield, JEPQ generates approximately $83 per month for every $10,000 invested. To generate $500 monthly, you’d need about $60,000 invested; for $1,000 monthly, about $120,000; for $2,000 monthly, about $240,000. Use the Dividend Whale Calculator to model different investment amounts and see the resulting monthly income projections. Remember these are gross amounts before taxes unless held in a Roth IRA. For retirement income planning, many advisors suggest JEPQ or similar covered call ETFs represent perhaps 15-30% of a total portfolio rather than putting all retirement assets into a single strategy.
🎯 Making Your JEPQ Dividend Decision
JEPQ has established itself as a compelling option in the covered call ETF space, offering one of the highest yields among major ETFs combined with professional management and exposure to leading technology companies. The 10.9% dividend yield with monthly distributions makes it particularly attractive for income-focused investors, especially those in or nearing retirement who can hold shares in tax-advantaged accounts.
However, JEPQ is emphatically not a free lunch or a magic income solution. The high income comes at the cost of capped upside potential in strong bull markets, modest downside protection in sharp sell-offs, and tax inefficiency in taxable accounts. These are features, not bugs—they’re the intentional design of a covered call strategy that converts potential capital appreciation into current income.
For the right investor—someone prioritizing current income over maximum capital appreciation, holding shares in a tax-advantaged account, comfortable with technology sector concentration, and understanding the trade-offs involved—JEPQ can be a valuable portfolio component. The monthly cash flow can supplement Social Security and pension income, support retirement living expenses, or be reinvested to compound returns over time.
For the wrong investor—someone who needs maximum long-term growth, cannot access tax-advantaged accounts, is in a high tax bracket, or seeks absolute principal preservation—JEPQ is likely to disappoint relative to better-suited alternatives.
Before investing, carefully consider whether JEPQ’s characteristics genuinely align with your:
- Income needs (do you need current cash flow or long-term growth?)
- Tax situation (can you hold it in an IRA/Roth or only taxable accounts?)
- Risk tolerance (can you emotionally handle the equity volatility JEPQ still experiences?)
- Investment horizon (are you already in retirement or still decades away?)
- Sector comfort (are you okay with heavy technology concentration?)
Use the Dividend Whale Calculator to model exactly how much monthly income you could generate at different investment levels. Input various scenarios to see how JEPQ might fit within your broader portfolio alongside other income sources and growth investments.
Remember that successful retirement income planning typically involves diversifying across multiple strategies rather than concentrating everything in one fund. JEPQ can be an excellent tool in your income toolkit, but it works best as part of a balanced approach that also includes other asset classes, income strategies, and risk management techniques.
Finally, stay informed about JEPQ’s ongoing performance and make adjustments as your needs change. What makes sense at age 55 while still working might differ from what’s optimal at age 65 in early retirement, and that may shift again at age 75 as you progress through different retirement stages. Review your JEPQ allocation annually to ensure it continues serving your evolving financial needs.
📚 References and Further Reading
For additional information about JEPQ and covered call ETF strategies, consider these authoritative sources:
- JPMorgan Asset Management provides detailed fund information, monthly fact sheets, and distribution history on their official JEPQ page
- Morningstar offers independent fund analysis and ratings in their JEPQ research coverage
- ETF Database maintains comprehensive metrics and comparison tools for JEPQ and similar income ETFs
- Stock Analysis provides detailed dividend history and payment tracking for JEPQ investors
- The Motley Fool offers investor perspectives and comparisons in their covered call ETF analysis
⚠️ Disclaimer
This content is for educational and informational purposes only and should not be construed as financial advice, investment recommendation, or a solicitation to buy or sell any securities. JEPQ dividend payments are not guaranteed and can vary significantly based on market conditions. Past performance does not guarantee future results.
All investment decisions involve risk, including the potential loss of principal. Covered call strategies involve specific risks including capped upside potential and exposure to equity market volatility. Before investing in JEPQ or any ETF, carefully review the fund’s prospectus, consider your investment objectives, risk tolerance, and time horizon, and consult with a qualified financial advisor who understands your personal financial situation.
The Dividend Whale and its content creators are not registered investment advisors and do not provide personalized financial advice. Tax treatment of JEPQ distributions can be complex and varies based on individual circumstances—consult a qualified tax professional for guidance specific to your situation. The tax rates and brackets referenced in this article are approximations for illustrative purposes and may not reflect current tax law or your specific situation.
Dividend yields, distribution amounts, and fund performance data cited in this article are based on historical information and current market conditions as of April 2026 and are subject to change. Always verify current information through official fund sources before making investment decisions.